Performance
Understanding Performance Monitoring
This chapter contains instructions for monitoring the storage performance. The VPSA Performance Monitor allows you to check and monitor the behavior of each element that can affect the overall storage performance, from a single drive to the whole VPSA system and the Servers attached to it.
Each element of the data path can impact the overall performance if not configured and operated properly. The VPSA performance Monitor is a tool for pinpointing a storage performance bottlenecks. The following metrics are of interest in measuring the performance of a storage system:
Bandwidth (Throughput): This value is how much read or write throughput a certain Resource (disk, pool, volume, etc.) delivers. Usually expressed in Megabytes/Second (MB/s)
IOPS: IO operations per second, which is the amount of read or write operations completed in a one second interval. A certain amount of IO operations will also give a certain throughput of Megabytes each second, so these two are related.
Average IO size x IOPS = Throughput
Response time (Latency): is the time it takes each IO operation to complete. Latency is measured in milliseconds (ms) and should be as low as possible.
The Performance Monitor
To view the VPSA Performance Monitor, go to System > Performance.
The Performance Monitor screen consists of the following elements:
Resources Tree: The Resources Tree lists all the data path objects currently exist in the VPSA
Pools (including the RAID Groups and Drives that each pool is made of)
Volumes
Servers mapped to this VPSA
Controllers
System Cache
Note
VPSA Flash Array
For the VPSA Flash Array, there are additional performance parameters for the Pool regarding the data reduction activities and other elements of the data path, such as write buffer activity, dedup accuracy, activity distribution between tiers, and more.
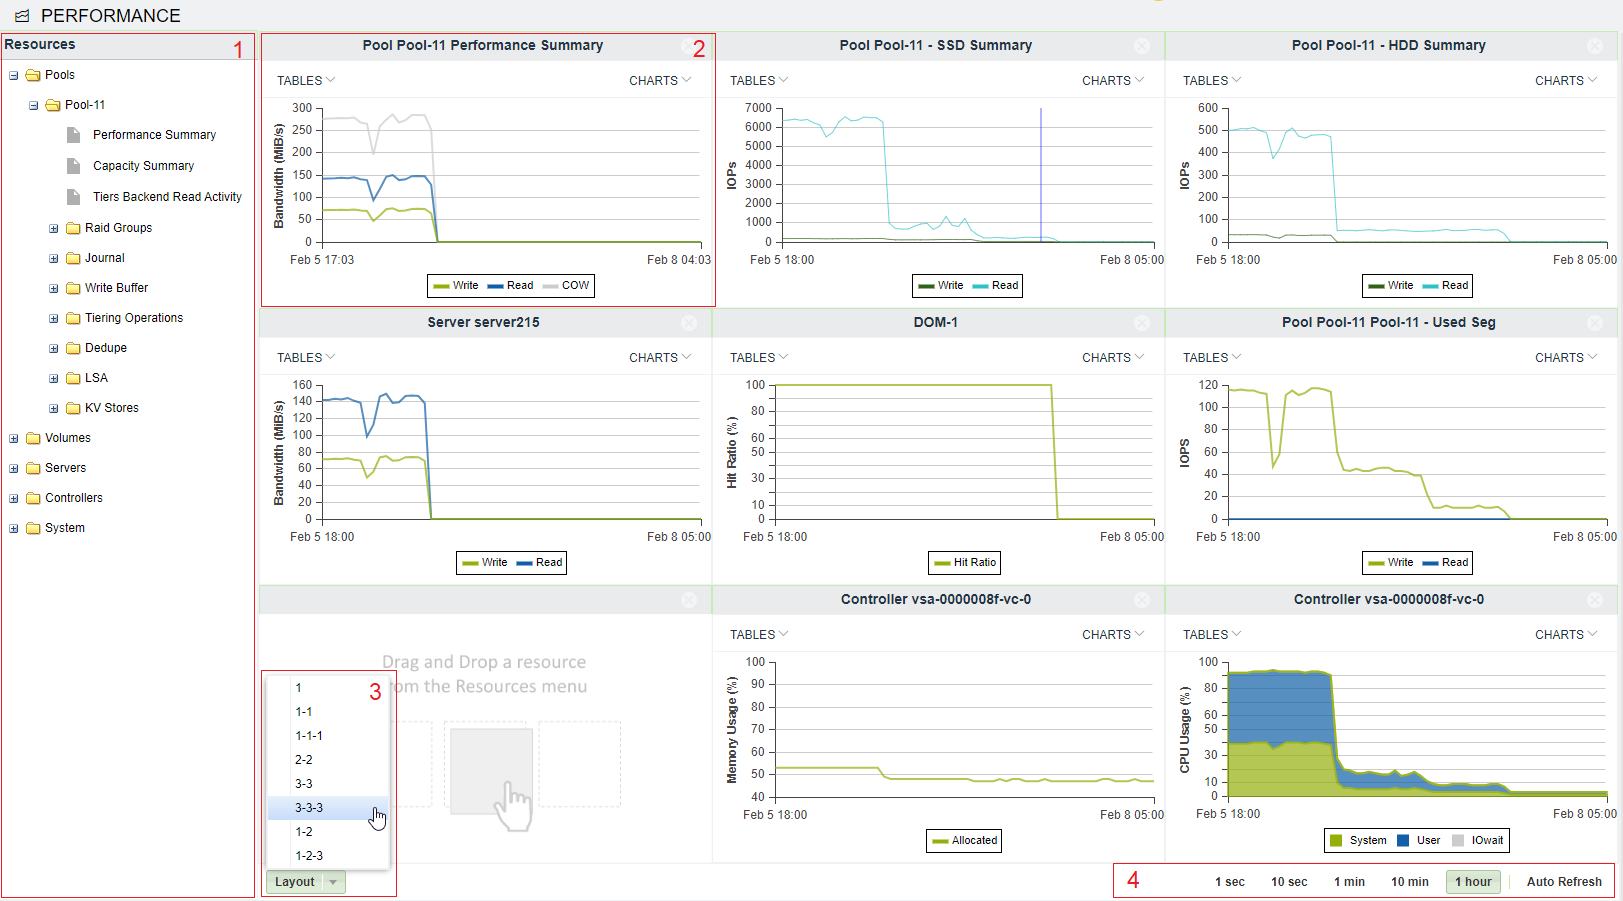
Resource Tile: The Performance Monitor has 1 to 9 resource tiles depending on the chosen layout. Each tile contain either table or chart.
Layout Selector: Selector for the number of rows of tiles and tiles per row.
Interval Selector: Allows switching between different intervals. The interval is a sampling period. Each interval is a single point in the chart. This point represents the average value during that interval. The chart always shows 60 intervals.
For example: If a 1 minute interval is selected, 60 points are displayed, and each point is the average value for that specific minute. In total, the last hour is displayed.
The interval selection affects all tiles.
Customizing the Performance Monitor
Customizing the Layout
Go to System > Performance and click Layout.
Select the layout of your choice. Note that if the selected layout has fewer tiles than the original, the other tiles will be lost.
Drag the object of interest from the resources tree, and drop it into a tile. Repeat for all tiles.
Customizing a Tile
Each tile represent a single resource, and provides a number of display options related to the specific resource. The display can be either a table of the most current performance figures, or a chart over time of the recent history.
To display a chart click Charts at the top right corner of the tile, and select the metric of interest.
To display a table click Tables at the top left corner of the tile, and select the table of interest. The table provides performance information as well as other parameters such as data reduction ratio.
Note
Some of the performance metering charts and table are for Zadara support use only.